
pdb, Post-Mortem & Bisecting
In short: debugging is a loop with a clear exit at every step —
reproduce the failure on demand, narrow the input or code path,
hypothesise in one sentence, test it with the smallest check that
can confirm or kill it, then fix and pin it with a regression test
written before the fix. A traceback reads bottom-up: the last frame is
where the exception surfaced, not necessarily where the mistake is.
Post-mortem debugging walks that same chain of frames with every local
variable still alive, which is what pdb's post-mortem mode gives you
interactively. And when you don't know where to look at all —
across 120 changes, or a 40,000-row batch — bisecting halves the search
every time, so the cost grows only with the logarithm of the size.
At 03:12 last night Quarry's nightly summary crashed. The log holds one
line — ZeroDivisionError: division by zero — and a batch of forty thousand
rows. Tests tell you that something is wrong. Debugging is the other half:
finding where, why, and which input — quickly, without guessing.
Read a crash from the bottom up, then look inside it
When an exception escapes, Python prints a traceback: the chain of calls in progress when it happened, most recent call last — so the story reads from the outside in, and the very last frame is where the exception was raised.
Read it from the bottom: what went wrong (ZeroDivisionError), where
(inside rate, on errors / total), how we got there (nightly called
summarise, which called rate). The bottom frame is where the error
surfaced — not necessarily where the mistake is. Here the mistake
is upstream: a stage with zero rows should never have reached rate at
all.
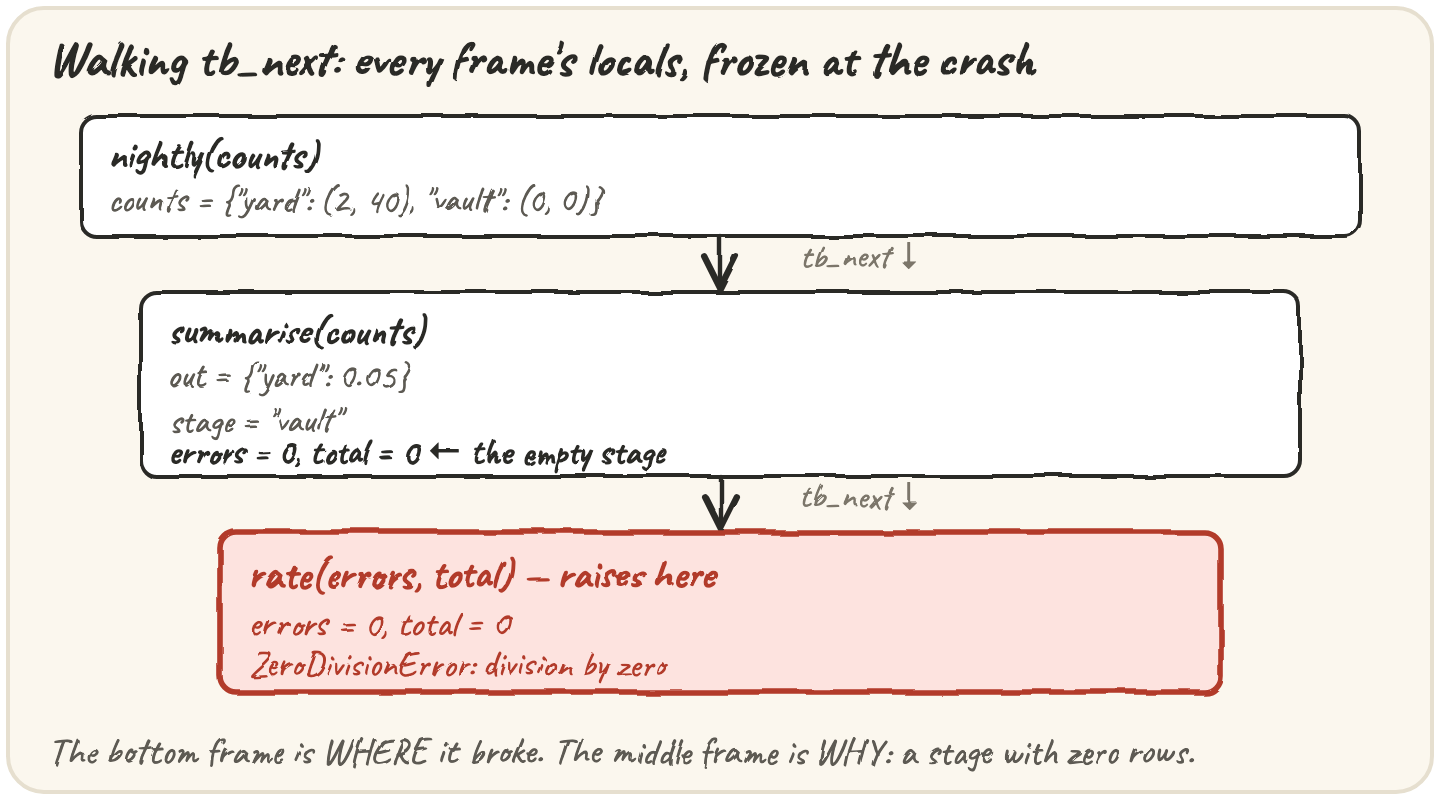
A traceback is also an object you can walk, one link per frame:
def inner():
    return 1 / 0

def middle():
    return inner()

def outer():
    return middle()

try:
    outer()
except ZeroDivisionError as exc:
    tb = exc.__traceback__
    while tb.tb_next:
        tb = tb.tb_next
print(tb.tb_frame.f_code.co_name)Python ships a debugger, pdb: put breakpoint() on a line, run in a
terminal, and execution pauses with a (Pdb) prompt where you can print
variables, step, and move between frames (p, n, s, w, u/d,
c). Its most useful trick is post-mortem: run under python -m pdb
and when the program dies you land inside the dead frame, locals and all
— no guessing which print to add, you just look. pdb needs an interactive
terminal, which this page doesn't have, but post-mortem is built on
something that does work here: the traceback object keeps every frame
alive.
Three frames, and the answer is in the middle one: stage = 'vault',
errors = 0, total = 0. The vault stage had no rows, and nobody expected
that. Walking tb_next from outside in is exactly pdb's d command;
each frame's f_locals is exactly what p shows you.
Print debugging, done properly
There's no shame in print, as long as it answers a precise question. The
= specifier in an f-string prints the expression and its value, so you
never mislabel a number:
errors, total = 3, 40
print(f"{errors / total=}")Three rules keep it from turning into archaeology: print values, not "got
here"; print once before and once after the suspect line; delete the
prints once the hypothesis is settled. Not every bug crashes — the hard
ones return a wrong answer quietly. Quarry's dashboard averages the last
n runs, and it's always a little off:
The last two runs took 30 and 40 seconds, so the average should be 35.0. It prints 30.0. Find the slice bug and fix it.
Same loop: reproduce ([10, 20, 30, 40], n=2), hypothesise ("the slice is
one short"), test (print(f"{recent=}") shows [30]), fix, then
assert recent_average([10, 20, 30, 40], 2) == 35.0 joins the suite for
good.
Halve your way to the one change — or the one row — that matters
Sometimes you don't know where to look at all, only that version 1.4 worked and 1.9 doesn't, with 120 changes between. Checking each would take all day — test the middle instead. Good, the bug arrived in the later half; bad, the earlier half. Each check halves what's left:
Seven checks instead of up to 120. Finding the bad change among 5,000 takes
thirteen — doubling the history adds just one more check, which is why
bisecting is worth doing even when a single test takes minutes. (git bisect start, mark one commit bad and one good, and
git bisect run pytest ... does the testing itself.)
The same idea works on inputs. A batch of forty thousand rows crashes
the vault — which rows matter? Remove some; if it still crashes, they
weren't needed. Keep removing until nothing more can go — the random-input
version of this from the last lesson, here aimed at a real failing batch.
That's the piece you build now. Before you close a bug: write the
regression test first, on the narrowed input, and watch it fail; fix
the cause, not the symptom (wrapping rate in try/except hides the
crash — decide what an empty stage should actually report); and look for
siblings — if one count could be zero, where else is a count used as a
divisor?
Quick practice
def first_bad(results):
    lo, hi = 0, len(results)
    while lo < hi:
        mid = (lo + hi) // 2
        if results[mid]:
            lo = mid + 1
        else:
            hi = mid
    return lo if lo < len(results) else -1

print(first_bad([True, True, True, False, False]))def post_mortem_depth(exc):
tb = exc.__traceback__
depth = 0
while tb:
depth += 1
tb = tb.tb_next
return depth
def c():
return 1 / 0
def b():
return c()
def a():
return b()
try:
a()
except ZeroDivisionError as exc:
print(post_mortem_depth(exc))🎯 Your turn
Build narrow_failure(rows). crashes(rows) (in the starter) reports
whether the vault's loader blows up on a list of row ids — it does when an
id appears twice. If rows doesn't crash, return it unchanged. Otherwise
narrow it: scan from the left, trying to delete one element at a time;
whenever the shorter list still crashes, keep it and start scanning again
from the left. Stop when no single deletion still crashes, and return
what's left.
narrow_failure(["q1", "q2", "q3", "q2"])   # → ["q2", "q2"]
narrow_failure(["x", "y"])                 # → ["x", "y"]  (doesn't crash)