
Debugging Memory Leaks
In short: a JavaScript memory leak almost always comes down to one thing: something is still reachable that shouldn't be — an interval still running, a listener still attached, a closure still holding onto data nobody needs anymore. None of these are exotic bugs; they're all ordinary code that simply never let go. This lesson is read-only — a real leak only shows up over time, in a real page, watched through DevTools' Memory tab, not in a single run of a snippet.
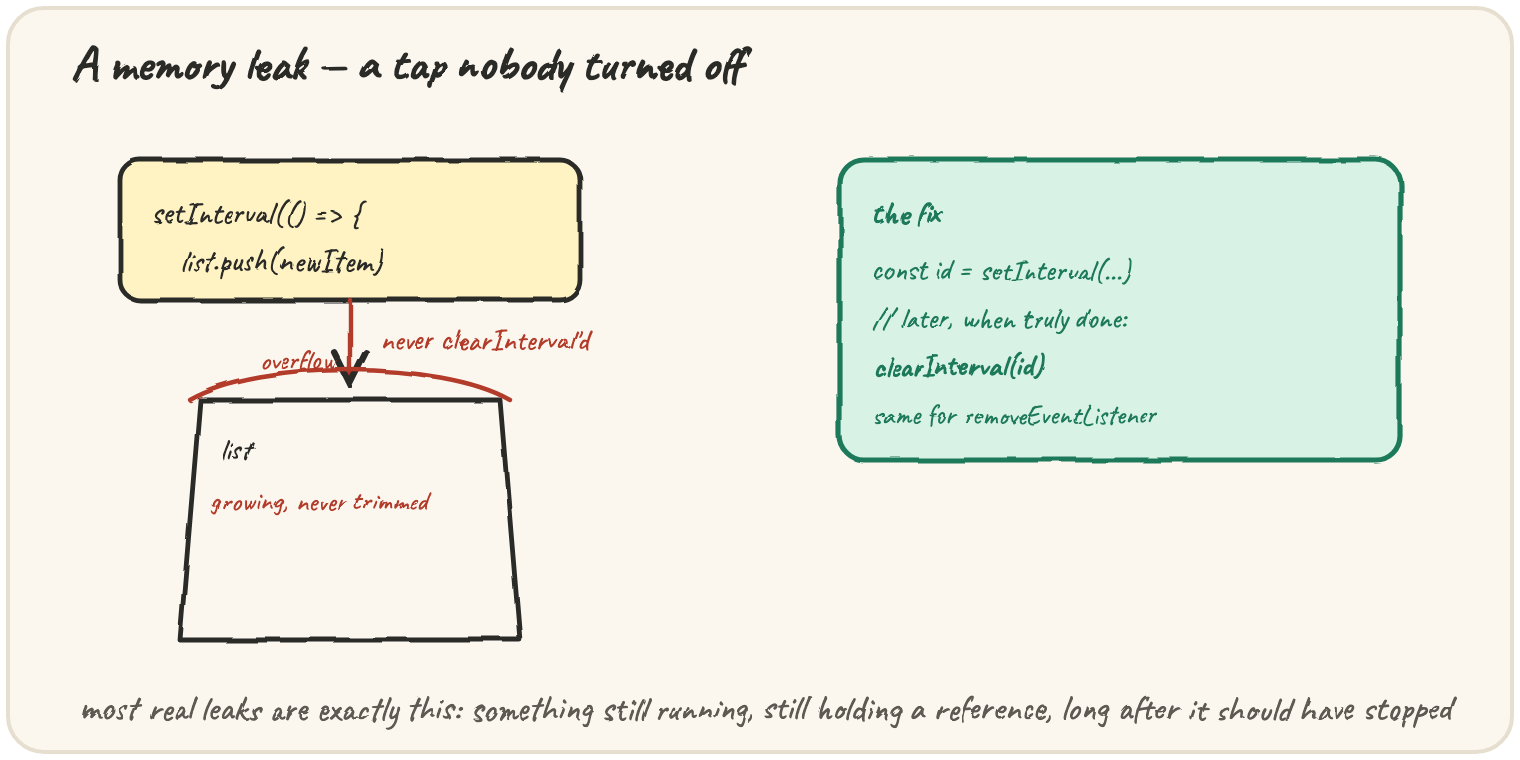
An interval that outlives its purpose
The single most common leak: a setInterval (or setTimeout chain)
that's never cleared.
function startPolling() {
  setInterval(() => {
    fetchLatestNotifications().then((list) => renderNotifications(list));
  }, 5000);
}
startPolling();
Nothing here ever calls clearInterval. Every five seconds, forever,
this keeps running — and if startPolling gets called again later (say,
the user navigates away and back), a second interval starts stacking
on top of the first, each one still reachable through the timer system
itself. The fix is always the same shape: keep the id, and clear it when
you're genuinely done.
function startPolling() {
  const id = setInterval(() => {
    fetchLatestNotifications().then((list) => renderNotifications(list));
  }, 5000);
  return () => clearInterval(id); // call this when leaving the page
}
An event listener that's never removed
The same pattern, with addEventListener:
function setupSearchBox(input) {
  document.addEventListener("click", function handleOutsideClick(event) {
    if (!input.contains(event.target)) {
      input.value = "";
    }
  });
}
Every call to setupSearchBox registers another listener on document —
a root that's always reachable — and none of them are ever detached. Each
listener, plus anything it closes over, stays reachable forever through
document. The fix is to keep a reference to the handler and call
removeEventListener with it once the component using it goes away.
A cache that only ever grows
Not every leak involves timers or listeners — sometimes it's just a structure nothing ever trims:
const responseCache = {};

function cachedFetch(url) {
  if (responseCache[url]) return Promise.resolve(responseCache[url]);
  return fetch(url)
    .then((r) => r.json())
    .then((data) => {
      responseCache[url] = data; // added, but never removed
      return data;
    });
}
Every unique url ever fetched adds one more permanent entry to
responseCache, which lives at module scope and is reachable for the
life of the program. For a handful of URLs this is harmless; for a page
that constructs many unique URLs over a long session, it grows without
bound. A real fix caps the cache's size or expires old entries — the
leak isn't the cache itself, it's a cache with no limit.
Reading the symptom in a heap snapshot
All three patterns share the same fingerprint in DevTools' Memory tab: take a snapshot, repeat the suspect action several times, take another snapshot, and compare. A genuine leak shows the count of some object type — listener functions, cache entries, detached DOM nodes — climbing between the two snapshots and never coming back down, even after the action that created them is long finished.
🎯 Your turn
A single-page app calls document.addEventListener("click", handleClick)
every time a particular component is shown, but never calls
removeEventListener when the component is hidden or removed. Explain
why this leaks memory, and what visiting that part of the app repeatedly
would do to a heap snapshot comparison.
Quick practice
What do an uncleared setInterval and an unremoved event listener have in common as leak causes?
What is the actual fix for an interval that's leaking memory?
What pattern in two compared heap snapshots points to a real memory leak?