
Debugging with DevTools
In short: browser DevTools (open it with F12, or right-click →
Inspect) is a set of tools built into the browser itself, working on
the page you have open — so this lesson describes what you'll see and
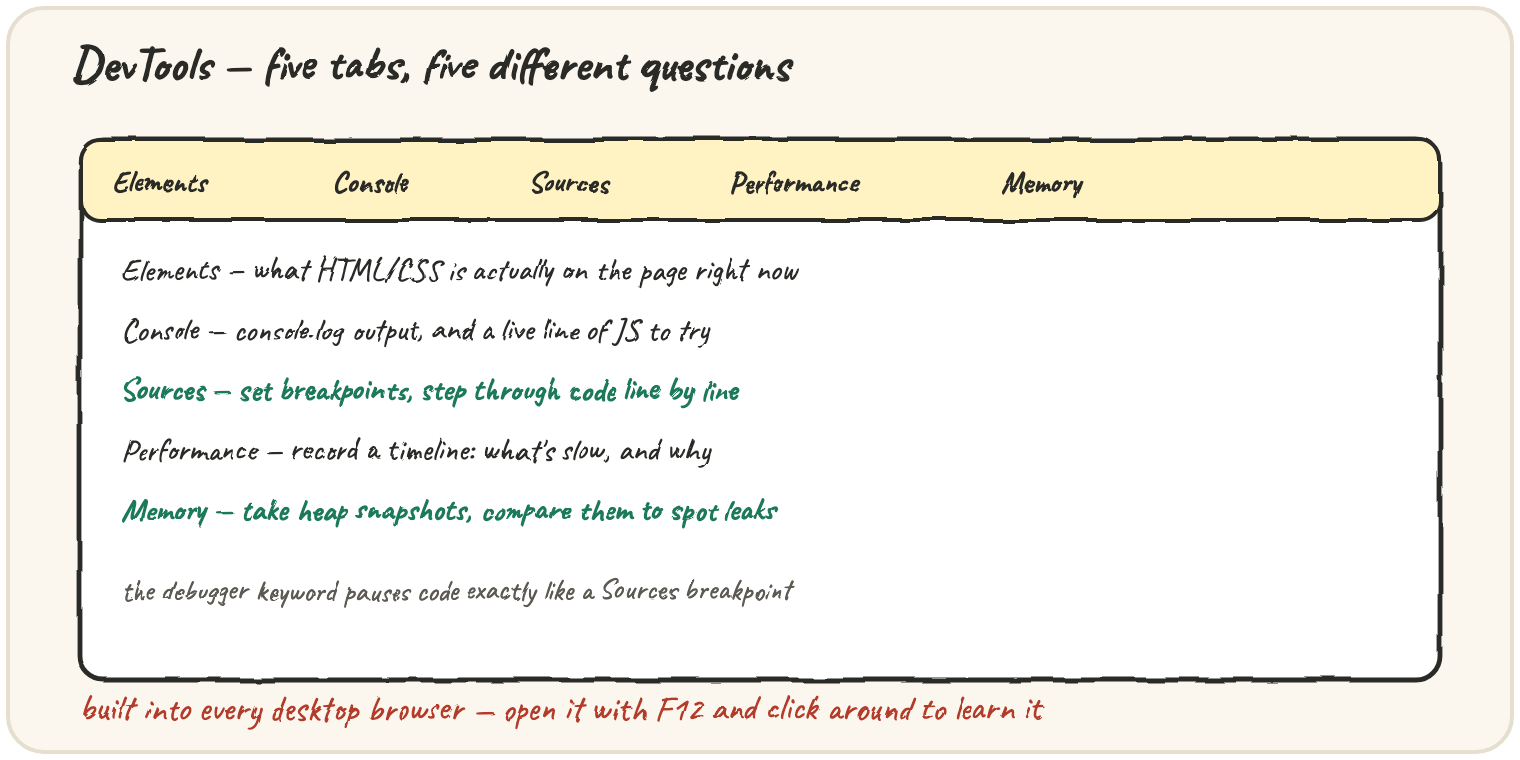
click, rather than code to run. Five tabs answer five different questions: Elements
(what's actually on the page right now), Console (run JS, see logged
output), Sources (pause and step through code with breakpoints),
Performance (record a timeline of what's slow), and Memory (take
heap snapshots to compare and spot leaks). This lesson is read-only —
open DevTools on any page and follow along.
Pausing code exactly where you need to look
The Sources tab is where most real debugging happens: click a line
number to set a breakpoint, then reload or trigger the code path. When
execution reaches that line, the whole page freezes, and you can inspect
every variable in scope, hover over expressions to see their current
value, and step through the following lines one at a time with the
play/step controls. The debugger; statement, written directly in your
code, does the exact same thing — it pauses execution there as if you'd
clicked to set a breakpoint on that line, without needing DevTools open
in advance.
function applyDiscount(total, code) {
  debugger; // execution pauses here once DevTools is open
  if (code === "SAVE10") return total * 0.9;
  return total;
}
A breakpoint answers "what is actually happening at this exact moment,"
which is a different, often more powerful question than "what did I
decide in advance to print with console.log."
Reading what's slow, not just what's wrong
The Performance tab records a timeline while you interact with the page, then breaks that timeline down into what the browser spent time on: scripting, rendering, painting. A tall block of "scripting" time pointing at one function is the browser telling you exactly where to look first, instead of guessing which part of the code is slow.
The Console and Elements tabs matter here too, in smaller ways: the
Console is where most console.log output actually lands, and where you
can type a line of JS to try against the live page; Elements shows the
DOM as the browser currently has it — which can differ from the original
HTML once JavaScript has modified it.
Comparing two moments in memory
The Memory tab takes a heap snapshot — a complete picture of every object currently allocated, and what's keeping each one reachable. Taking two snapshots at different points (say, before and after repeating some action several times) and comparing them is the standard way to confirm a suspected leak: if the same kind of object keeps showing up with a growing count between snapshots, something is holding onto objects it should have let go of.
🎯 Your turn
Explain what a breakpoint in the Sources tab lets you do that scattering
console.log statements through your code does not, and why you might
still prefer console.log for some situations.
Quick practice
Which DevTools tab do you use to pause code execution at a specific line and inspect variables?
What does the debugger; statement do when written directly in your code?
What is a heap snapshot, in the Memory tab, mainly used for?