
Capstone: Meridian's Coverage Map
In short: this capstone puts two things from this section together into
one report a depot manager would actually read. The convex hull (lesson
3) turns a scattered list of stops into the boundary Meridian's service area
actually draws on the map. The shoelace formula turns that boundary into
one number: the area it encloses, found from the vertices alone — sum
x_i * y_{i+1} - x_{i+1} * y_i around every edge, take the absolute value,
halve it. No new geometry idea here, just the orientation test and the hull
it builds, read all the way through to a number a dashboard can show.
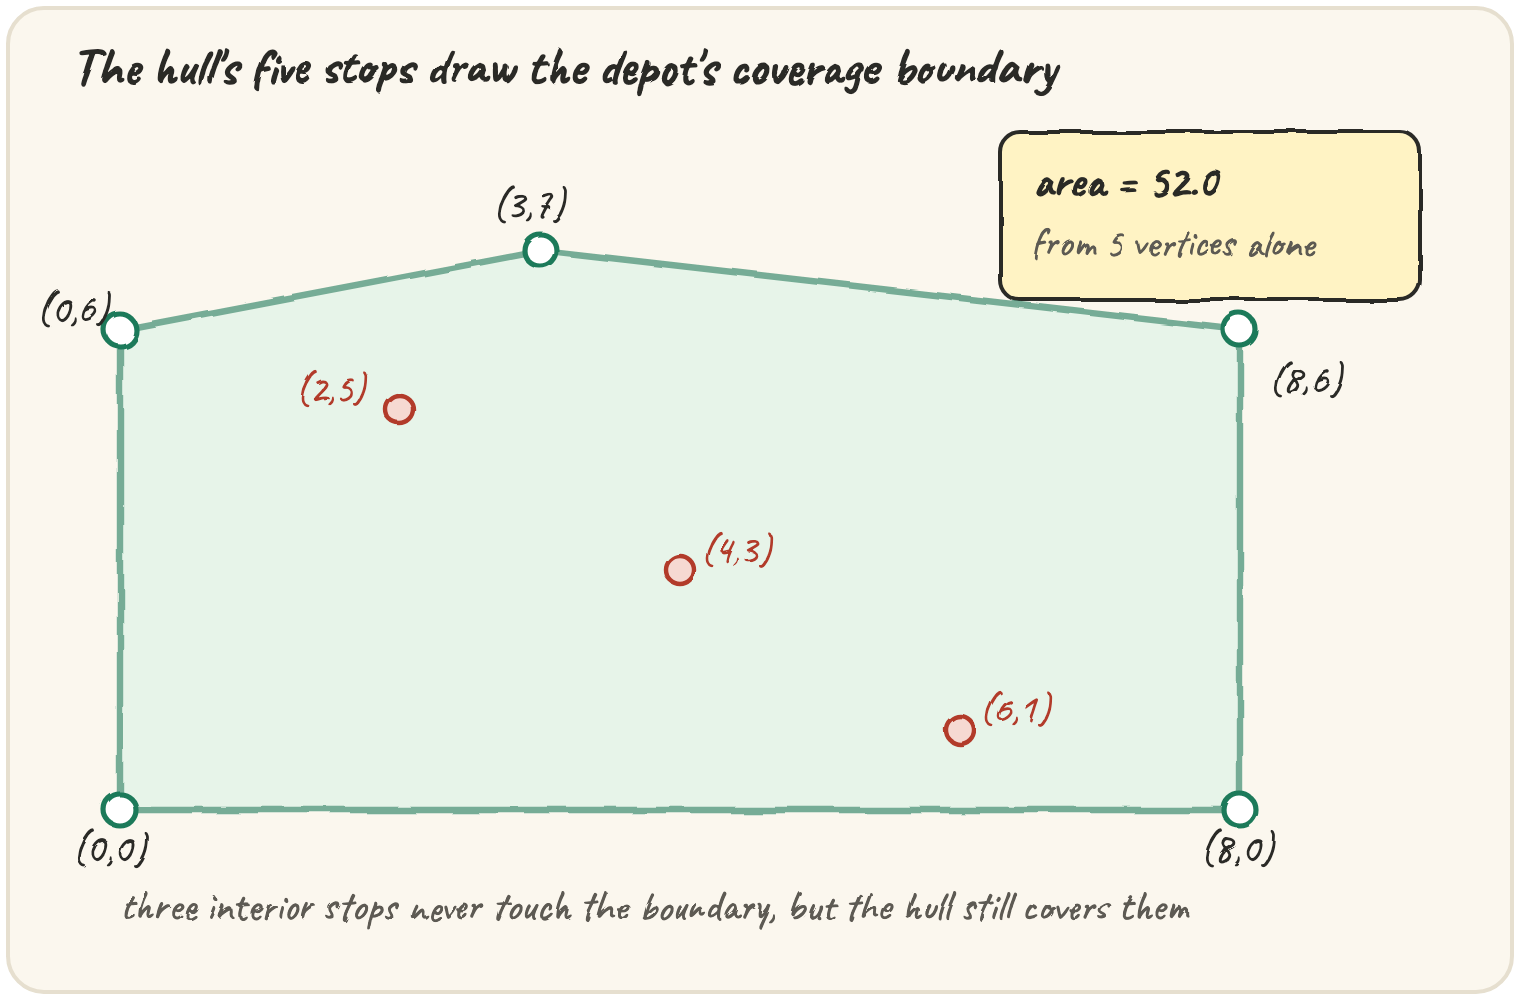
A depot's service boundary, with a number attached
Eight of Meridian's stops, four of them sitting inside wherever the others end up:
Five stops make the boundary; three — (4,3), (2,5), (6,1) — sit
inside it and never show up in hull at all. The area comes out to exactly
52.0, found without ever drawing anything: just the hull's five vertices,
fed through one formula.
A new stop can grow the boundary, or change nothing
Add one new stop far outside the current boundary, and both the hull and the area change. Add one well inside it, and nothing does:
(4, 3) sits in the middle of the rectangle, so convex_hull pops it right
back off — the report comes back identical, area 48.0 both times.
(12, 2) sits well past the eastern edge, so it becomes a new vertex on the
boundary, and the shaded area grows from 48.0 to 64.0.
Quick practice
def shoelace_area(polygon):
    n = len(polygon)
    total = 0
    for i in range(n):
        x1, y1 = polygon[i]
        x2, y2 = polygon[(i + 1) % n]
        total += x1 * y2 - x2 * y1
    return abs(total) / 2

print(shoelace_area([(0, 0), (5, 0), (5, 4), (0, 4)]))hull = [(0, 0), (4, 0), (4, 4), (0, 4)]
hull_set = set(hull)
stops = [(0, 0), (4, 0), (4, 4), (0, 4), (2, 2)]
print([p for p in stops if p not in hull_set])🎯 Your turn
Build coverage_report(stops): return [hull, area], combining
convex_hull from lesson 3 with the shoelace formula.
coverage_report([(0,0), (8,0), (8,6), (0,6), (4,3), (2,5), (6,1), (3,7)])→[[(0,0), (8,0), (8,6), (3,7), (0,6)], 52.0]coverage_report([(0,0), (4,0), (4,4), (0,4)])→[[(0,0), (4,0), (4,4), (0,4)], 16.0]
Hint: build the hull exactly as in lesson 3 — dedupe with
sorted({tuple(p) for p in points}), not sorted(set(points)), since
stops arrives as plain [x, y] lists. Then shoelace: sum
x_i * y_{i+1} - x_{i+1} * y_i for every edge (wrapping with % n), take
abs(), divide by 2.
Press ▶ Run, try the Live App chips, then ✓ Check.