
Capstone: Quarry's Analytics Engine
In short: one lazy segment tree carries a sum and a minimum per
node plus a single pending add, because both aggregates can be updated
from a bump without looking at the children — the sum rises by d × width
and the minimum rises by exactly d. Range bumps, range totals and range
floors are all O(log n), the same three-case recursion as every segment tree
query, with push and pull as the two small helpers that keep the tag
honest.
Five lessons, five tools, each built because the one before it broke on some kind of change:
| lesson | handles | breaks on |
|---|---|---|
| prefix row | any range sum in O(1) | any edit: O(n) |
| √n blocks | edits and queries in O(√n) | a busy dashboard |
| Fenwick tree | point edits and sums in O(log n) | min, which can't be subtracted |
| segment tree | any combinable aggregate, with range edits via tags | pages on disk |
| B-tree | sorted keys on disk, a few reads per lookup | (it's the disk layer) |
Now Quarry's analytics engine needs all of the in-memory part at once. The operations team's list, word for word from the ticket:
- Backfill: "add
dto every minute fromltor", for clock skew, late batches and corrections. These arrive in bulk and can be wide. - Totals: "how many events between minute
land minuter?" - Floors: "what was the lowest count between
landr?", which is how the on-call team spots an outage: a stretch where traffic fell to nothing.
Range updates plus min rules out everything except the lazy segment tree. The
design question left is what each node has to carry.
One node, two answers, one tag
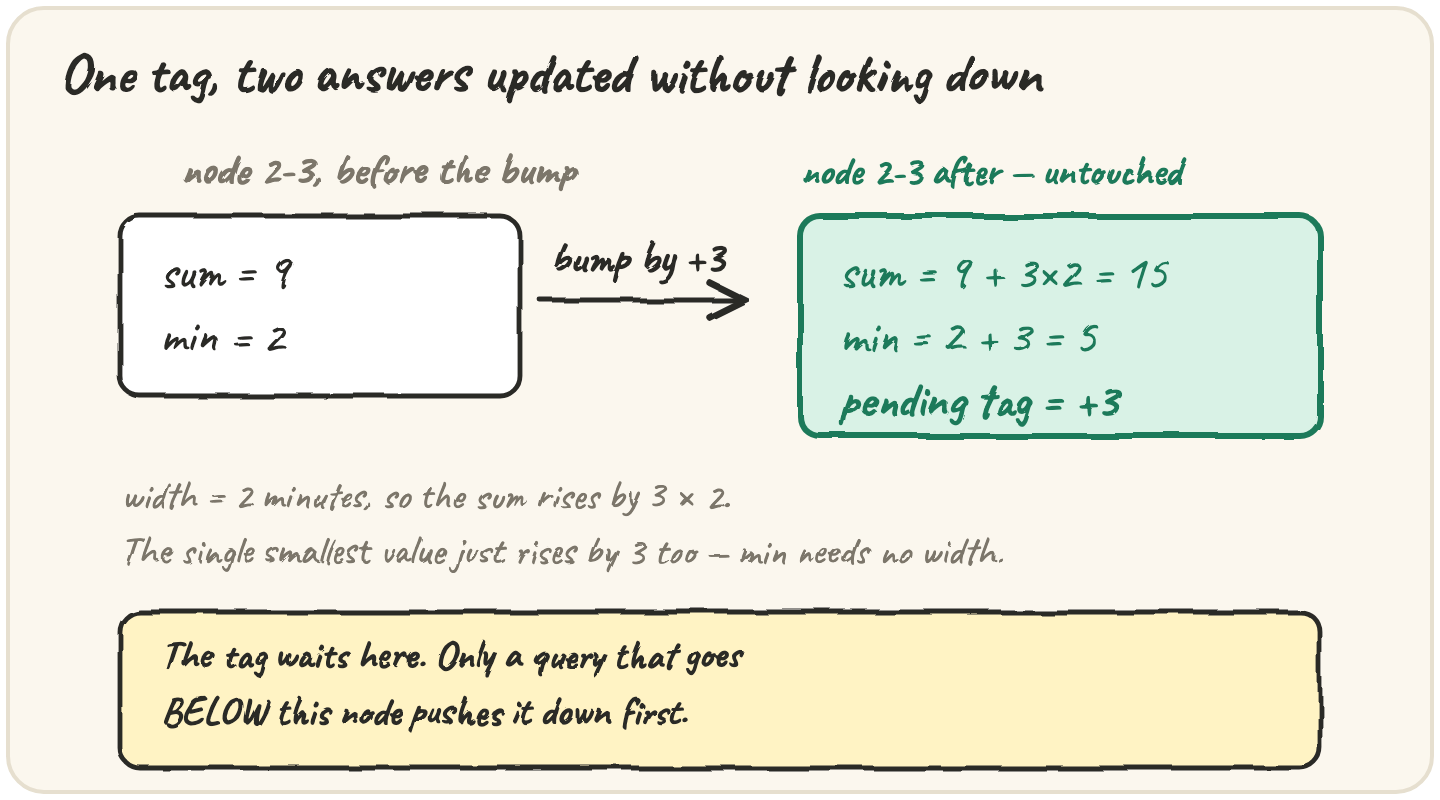
Each node stores the sum and the minimum of its range, plus one
pending add. The key question for any lazy tree is: when everything under a
node rises by d, can the node update its own answers without looking down?
- the sum rises by
d × width: every minute addsd; - the minimum rises by exactly
d: adding the same amount to every value keeps the same value smallest.
Both are yes, so one tag serves both aggregates. That test is the one to apply whenever you design a lazy tree. An update that replaces every value by its remainder mod 10 fails it, for example: the new sum depends on each value separately, so no node can update its answer without looking all the way down.
values = [4, 9, 2, 7]
d = 3
bumped = [v + d for v in values]
print(sum(bumped) - sum(values), min(bumped) - min(values))Here's the whole engine on four minutes. Each badge reads s for sum and m
for minimum, and a + is a pending tag:
One tag updates both answers. The bump stops at nodes it covers, and the later query pushes the tag only where it has to go deeper.
The log is 4, 9, 2, 7. Each node holds its range's sum and minimum. Binary tree, 7 nodes, height 3.
The code, in four helpers
Every lazy tree comes down to four small functions. Once these are right,
bump and each query are the three-case recursion you already know.
Get apply wrong and the tree still runs. It just gives wrong answers for
exactly the ranges that crossed a tag, which is the worst kind of bug to find in
production:
Bumping all four minutes of the log 4, 9, 2, 7 by 3 gives 7, 12, 5, 10: sum 34, floor 5. This reports a floor of 14, which isn't even one of the values.
Step through a push and watch the tag move down one level and disappear:
(Here node 3 owns minutes 2..3, and its children 6 and 7 are those minutes.)
def visits(lo, hi, l, r):
    if r < lo or hi < l or (l <= lo and hi <= r):
        return 1
    mid = (lo + hi) // 2
    return 1 + visits(lo, mid, l, r) + visits(mid + 1, hi, l, r)

print(visits(0, 7, 0, 7), visits(0, 7, 1, 6), visits(0, 1023, 1, 1022))Measuring it on real traffic
Here's the engine with every node as an object, running a small burst of the ops team's traffic. After each op the tree is redrawn with the nodes that op touched highlighted, and the caption counts them. Change the ops or the log, and watch the counts stay near the height of the tree however wide the ranges get:
Your analytics engine on a burst of traffic. The highlighted nodes are the ones each operation visited.
❓ Cross-question — "Where does the B-tree fit in?" Underneath. This engine holds the minute counts in memory for the live dashboard. The raw events they were counted from sit on disk in a B-tree keyed by timestamp. A backfill job range-scans the B-tree for the late events, counts them per minute, and sends the engine one
bumpper affected stretch. Each structure does the job its cost model suits.
Quick practice
values = [6, 1, 9, 3, 2]
d = 4
bumped = [v + d for v in values]
print(sum(bumped) - sum(values), min(bumped) - min(values))Children with sums 10 and 7 and minimums 5 and 2 should recombine to sum 17, min 2. This prints 17 5 — the floor comes back wrong because max was used instead of min.
🎯 Your turn
Build analytics(values, ops), Quarry's analytics engine. values is the
per-minute log. Each op is one of:
["bump", l, r, d]: adddto every minute inl..r;["sum", l, r]: the total of minutesl..r;["min", l, r]: the lowest count in minutesl..r.
Ranges include both ends. Return the answers to the sum and min ops, in order.
Every op must be O(log n): one lazy segment tree whose nodes carry a sum, a
minimum and a pending add.
analytics([4, 9, 2, 7], [["bump", 1, 3, 3], ["min", 2, 3], ["sum", 0, 2]])→[5, 21]
Then press ▶ Run, tap the Live App try chips to call it with different inputs, and hit ✓ Check. Green means Quarry's analytics engine is built. ✅